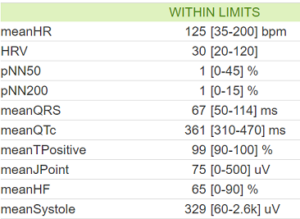
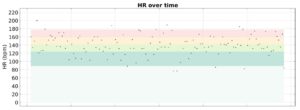
 meanHR
Units in beats per minute (bpm)
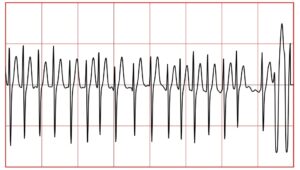
The heart rate (HR) is the number of times the heart beats in the space of a minute. The meanHR sum of the HR values divided by the number of values in the recorded session.
More info at https://litfl.com/ecg-rate-interpretation
Heart Rate Variability (HRV)
Is a simple measure related to the activity of the parasympathetic branch of the Autonomic (unconscious) Nervous System (ANS).Observing Heart Rate Variability (HRV) is a valuable tool for assessing cardiovascular health, optimizing sport performance, managing stress, sleep disorders, evaluating the autonomic nervous system, and optimizing performance in various fields, from biofeedback to therapy. HRV provides valuable information that can be used to make informed decisions about health and well-being.
Autonomic Nervous System Assessment
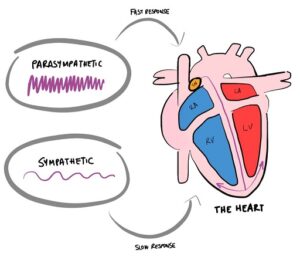
HRV reflects the fluctuations in the time intervals between heartbeats, allowing us to gauge the influence of the autonomic nervous system (ANS) on heart rate. Increased HRV indicates a healthy and balanced ANS, while reduced HRV may suggest an imbalance between the sympathetic (activation) and parasympathetic (relaxation) branches of the ANS.
The HRV of all measures decreases rapidly from the second to fifth decades. Healthy longevity depends on preservation of autonomic function, in particular, HRV-parasympathetic function, despite the early age-related decrease.
More info about Autonomic Nervous System https://medi-core.com/en/application/ans_function.html?ckattempt=1
Values of HRV
Values for Heart Rate Variability (HRV) can vary depending on age, health status, and the methodology used for measurement. HRV is measured in terms of variability between time intervals between heartbeats.
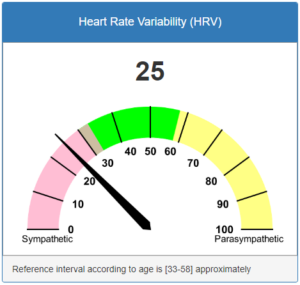
The app show a dial with a HRV measurement. The HRV measurements from our app and the other apps provide approx. the same information.
HRV is a measurement that is best interpreted in the context of the individual and their specific characteristics. Mainly comparing the evolution of values with respect to oneself, you need to establish a baseline of a few days to compare to before you can start comparing your recent past and telling you whether your Autonomic Nervous System (ANS). It’s important to understand that this metric is particular to you and isn’t something that you can target or compare with others.
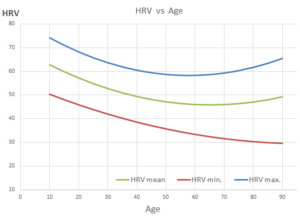
HRV range varies depending on age. We provide you with a table of average HRV by age group extracted from the 2010 article “Relation of High Heart Rate Variability to Healthy Longevity”. On the dial chart, we show the colors of the approximate range that would correspond according to age, according to the paper.
Higher variability is generally considered an indicator of a healthy cardiovascular and autonomic nervous system. Although very high values may indicate a less healthy state. What HRV would a person with an atrial fibrillation arrhythmia have?
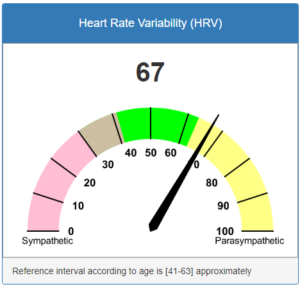
You can guess that HRV will be very high since the heart is beating irregularly. It may mistakenly seem that a high HRV is good, when it is actually a situation that requires attention. This video compares HRV and arrythmia https://www.youtube.com/watch?v=UgR_wNMWSh0
When heart rate is high we have modified the colors range to somehow indicate that a very high HRV situation requires attention.
HRV over time
During intense physical exertion, heart rate variability (HRV) tends to decrease due to activation of the sympathetic nervous system. In the recovery phase, HRV increases, influenced by the action of the parasympathetic nervous system. In the long term, training can improve resting HRV, indicating positive adaptation of the autonomic system to exercise. These patterns reflect the body’s physiological response and recovery ability during and after training.
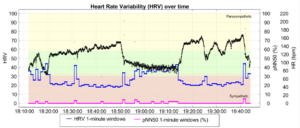
More reading about: Normal Values of Corrected Heart-Rate Variability in 10-Second Electrocardiograms for All Ages https://www.ncbi.nlm.nih.gov/pmc/articles/PMC5934689/
How to measure
In order for HRV and resting heart rate to have significance, it is essential to consistently measure them at the same time and under the same conditions each day, allowing you to establish a baseline. By accumulating sufficient data, you can identify patterns and derive meaningful insights from your HRV measurements.
https://www.trainingpeaks.com/
Measure yourself at the same time every day (ideally right after you wake up) and in the same position.
Maintain the same body position (standing for elite athletes, otherwise sitting).
Control the respiratory rate (7-10 breaths per minute). Particular attention should be paid to the inhalation phase to obtain the greatest consistency, inhaling from the belly through the nose, rather than from the chest.
Measure yourself at least 4-5 times a week
Keep a journal of your state of well-being and other comments for context.
More readings about: How to Interpret HRV to Reduce Stress and Increase Performance https://www.trainingpeaks.com/blog/how-to-interpret-hrv-training/
More readings about RHV:
More info about An Overview of Heart Rate Variability Metrics and Norms https://www.ncbi.nlm.nih.gov/
https://medium.com/@altini_marco/the-ultimate-guide-to-heart-rate-variability-hrv-part-1-70a0a392fff4
https://medium.com/@marco_alt/the-ultimate-guide-to-heart-rate-variability-hrv-part-2-323a38213fbc
pNN50
Units in percentile (%)
Is the percentage of beats, when between one beat and the next one, there is a difference of more than 50 milliseconds. This measurement is used to see the heart rate variability.
pNN200
Units in percentile (%)
Is the percentage of beats, when between one beat and the next one, there is a difference of more than 200 milliseconds. This measurement is used to see the heart rate variability.
More info at https://www.ncbi.nlm.nih.gov/pmc/articles/PMC5624990/
meanQRS
Units in milliseconds (ms)
Mean value of all QRS interval
https://litfl.com/qrs-interval-ecg-library/
meanQTc
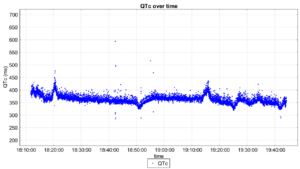
Units in milliseconds (ms)
Mean value of all QTc interval. Represents the total time from ventricular depolarization to complete repolarization. This process begins at the start of the q wave and extends to the end of the T wave.
More info at https://www.psychdb.com/meds/qtc https://www.ncbi.nlm.nih.gov/pmc/articles/PMC5337065/
meanTPositive
Units in percentile (%)
Is the percentage of positive T waves
T waves can be positive or negative, depending on the shape of the wave. Is a statistical percentage that indicates the number of waves that are positive (upright).
More info at https://litfl.com/ecg-library/basics/
meanJPoint
Units in microvolts (uV)
Mean value on Jpoint
https://litfl.com/j-point-ecg-library/
meanHF
Units in percentile (%)
Indicates the relative proportion of signal energy contained in higher-frequency components, from 2Hz to 8Hz. A higher % reflects a greater contribution of rapid fluctuations in the signal.
This metric does not distinguish whether these fast variations are physiological in origin or caused by noise or artifacts.
MeanHF can be used to compare recordings from the same subject, for example to observe changes between different conditions such as activity versus very high activity. This measure has no predefined normal range and no direct association with any specific physiological state.
It does not provide information about heart rate or heart rate variability.
meanSystole
Units in microvolts (uV)
It is the level of electrical potential of the signal
Heart Rate Effort Index
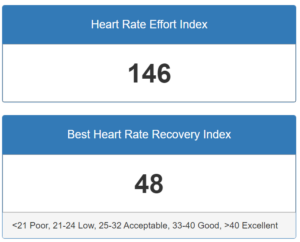
The HREI (Heart Rate Effort Index) is an index that summarizes, in a single number, the cardiovascular effort performed during an exercise session, in other words, the training load.
It is mainly calculated from the duration of the session and the intensity measured through heart rate. This measure is not physiologically exact, but it is a simple and useful indicator.
The method used for its calculation is based on the concept of TRIMP (TRaining IMPulse), which combines time and heart rate intensity. First, the relative heart rate reserve is calculated:
HeartRateReserve = (average HR – resting HR) / (maximum HR – resting HR)
Then, an approximate formula is applied:
HREI = duration in minutes × HeartRateReserve × Factor
Notes: In the App settings, you can configure the values for maximum HR and resting HR. Factor depends on biological sex.
The HREI is a personal metric and should not be used to directly compare different people, because it depends on maximum heart rate, resting heart rate, and individual fitness level.
For example, assuming a person with a resting HR of 60 bpm and a maximum HR of 190 bpm, a 30-minute session at 100 bpm would have an approximate HREI of 10, while a 30-minute session at 140 bpm would have an approximate HREI of 38. Although both sessions last the same amount of time, the second one generates a higher load because the heart rate is closer to the maximum heart rate and the effort increases.Is an intensity level measure of exercise (together with duration and frequency).
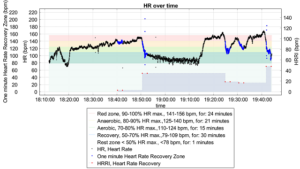
Best Heart Rate Recovery Index
If in your training you reach the zone of 90% of your maximum heartrate for one minute, when you go down from the zone, the graph of the recovery and the Heart Rate Recovery Index (HRR) will be displayed.
Heart Rate Recovery index is an estimate of maximal aerobic performance, which is influenced by aerobic fitness and running economy. It compares the highest number of heartbeats per minute (bpm) you can achieve in all-out effort and the lowest number of heartbeats per minute (bpm) at rest. By observing this value over time, you can monitor progress. Higher values mean that at a given pace it requires less effort, or that your pace is faster at a given level of effort.
Is similar to “Running Index” from Polar.
https://www.polar.com/blog/recovery-status-lets-talk-polar/
https://support.polar.com/e_manuals/M400/Polar_M400_user_manual_English/Content/Running_Index.htm
Both measures allow you to learn how much exercise and strain your body can take and how much rest is optimal for you.
RR-QTc Poincare plot
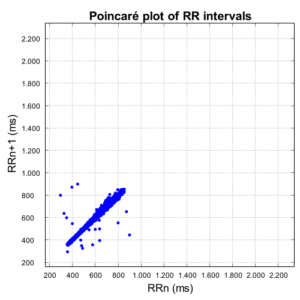
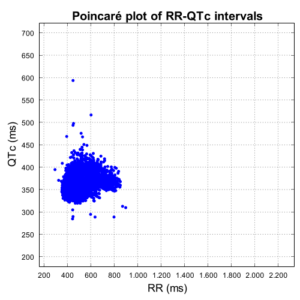
Very useful to heart rate variability and dispersion analysis vs QTc variation
https://www.researchgate.net/publication/341518420_Cardio-Diagnostic_Assisting_Computer_System
https://imotions.com/blog/learning/best-practice/heart-rate-variability/
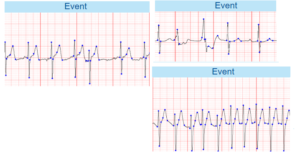
Events
The application in some type of signal can detect events where there is an etopic beats. No all irregular beats can be detected, and the number of beats detected are limited by memory device requeriments and user subscription plans.
Atrial Fibrillation and ECG Validation: Polar H10 Demonstrates Clinical Feasibility
A recent real-world clinical study has confirmed that ECG data recorded with the Polar H10 chest-belt sensor can be reliably interpreted by physicians for the evaluation of baseline cardiac rhythm, atrial fibrillation, and premature contractions in patients with a broad spectrum of heart conditions.
The study, conducted in the Czech Republic, demonstrated that long-term ECG recordings obtained from the Polar H10 are suitable for routine clinical practice, with only a minimal proportion of recordings affected by artifacts that complicate interpretation. ECG data were successfully analyzed in hospitalized patients, outpatients with cardiovascular disease, and healthy individuals.
Results showed that the vast majority of Polar H10 ECG signals were interpretable, allowing accurate assessment of baseline rhythm, atrial fibrillation detection, and identification of premature atrial and ventricular contractions. However, the authors recommend caution when interpreting ECG recordings in patients with paced rhythm or atrial flutter, where signal interpretation may be more challenging.
Overall, the findings support the use of the Polar H10 as a practical tool for continuous ECG monitoring, rhythm evaluation, and atrial fibrillation screening in both clinical and real-world settings. This study further strengthens previous research validating Polar H10 for heart rate measurement and short-term atrial fibrillation detection compared with standard ECG Holter monitoring.
Reference
Department of Internal Medicine I – Cardiology, Palacky University and University Hospital Olomouc, Olomouc
The measures and results are statistical and could be wrong.
Donwload Polar ECG Analysis App
To better understand physical, mental, and emotional states. Comprehend and identify potential areas for improvement, adjusting habits to optimize overall well-being.
