Please read the these instructions carefully to get the most of the App. This App runs with Polar H10® device.
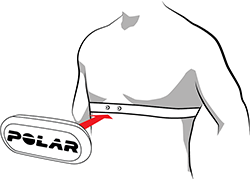
Wearing the sensor
- Moisten the electrode area of the strap.
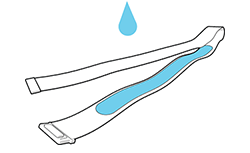
- Attach the connector to the strap.
- Fasten the strap around your chest and adjust the strap to fit snugly.
- Check that the Polar logo of the connector is in a central and upright position

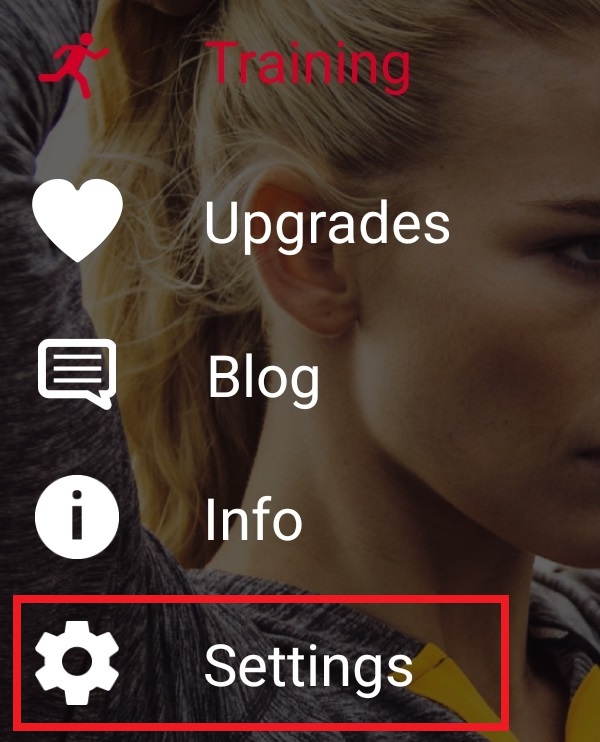
Pairing with the App
- Be sure that ‘others’ Polar App are closed.
- Wear the sensor
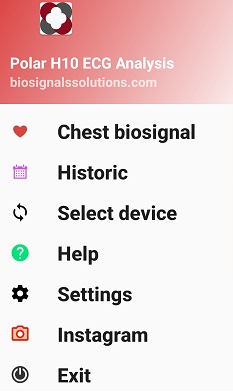
- Open Polar ECG Analysis App on your Android
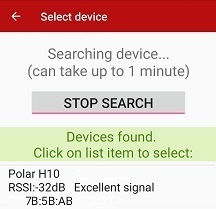
- Click on “Select device” to pair with the sensor.
- Click on the device listed: “Polar H10 ….”
Running the App
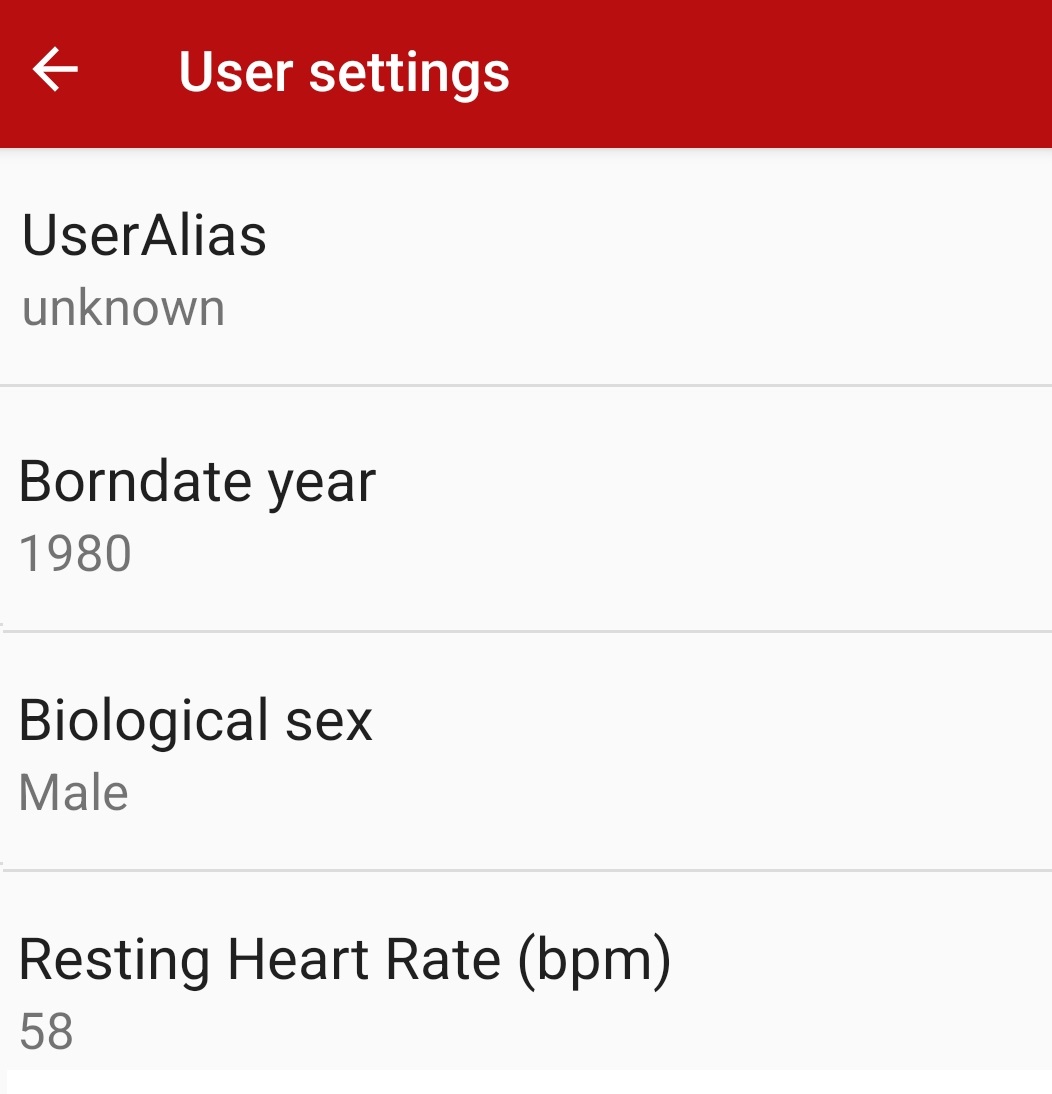
- Before starting to record signals, we recommend setting some user values for fine-tuning in results. A UserAlias should be an identifier that you use in your own systems. Make sure the identifier cannot be linked to personally identifiable information. In UserAlias field, the follow chars are not allowed: < (less than), > (greater than), : (colon), “ (double quote), / (forward slash), \ (backslash), | (vertical bar), ? (question mark), * (asterisk), “” (white space), _ (underscore)
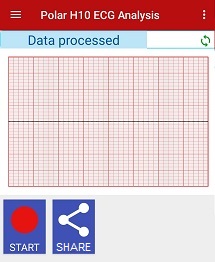
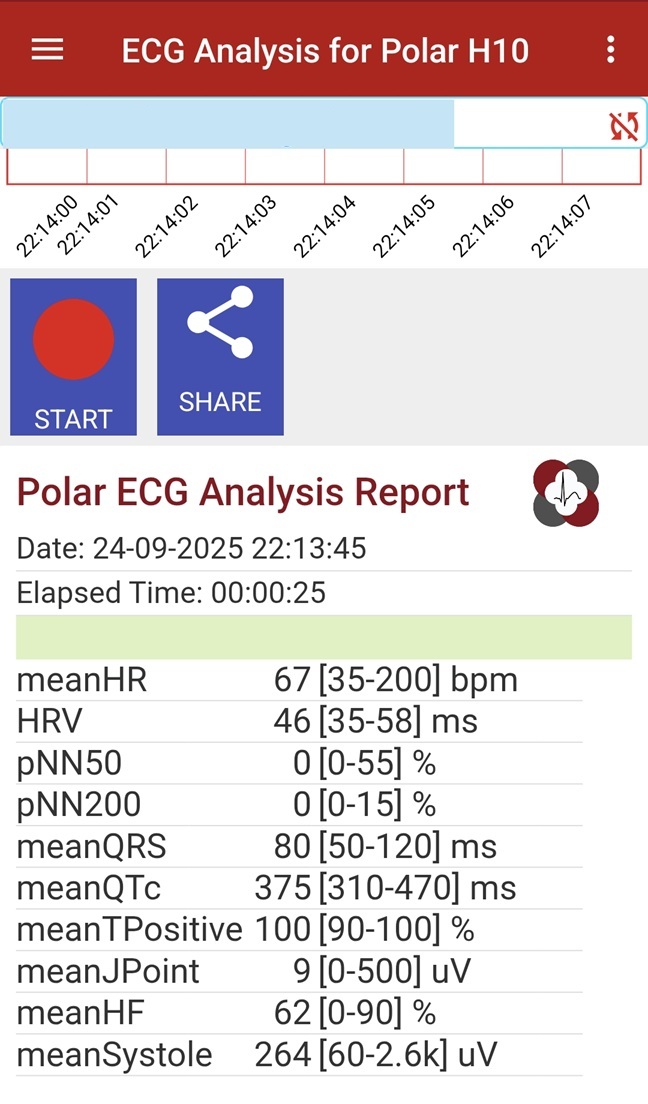
- Now you can start to record ECG by clicking “START”
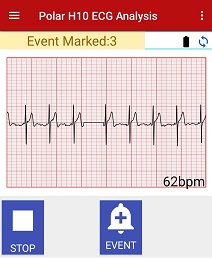
- Whenever you want, you can register an event by clicking “EVENT”
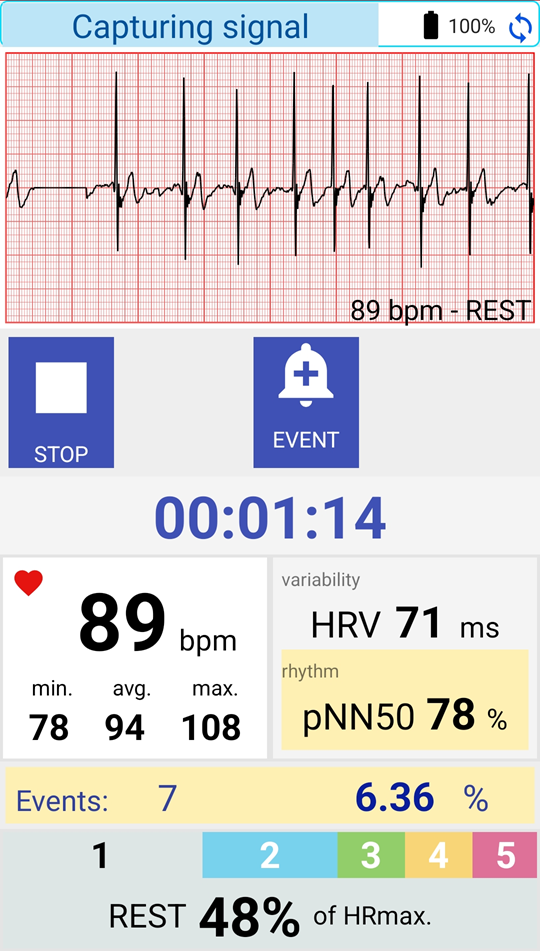
- When the signal is being recorded, the control panel shows in real time several values such as HRV, pNN50, the number of events, and the training zone.
During signal recording, different types of notifications can be configured with vibration and sound:
– If the heart rate is below the minimum training zone: one long high-pitched sound.
– If the heart rate is above the minimum training zone: two long high-pitched sounds.
– If the pNN50 value is above 45% (experimental): one short low-pitched sound.
– If the percentage of events is above 5% (experimental): one short low-pitched sound.
– If there is any event: one short low-pitched sound.
Note: The event may include artifacts or noise.
- You can stop recording by clicking “STOP”. Every 4 hours, a new file is saved in Historic item menu
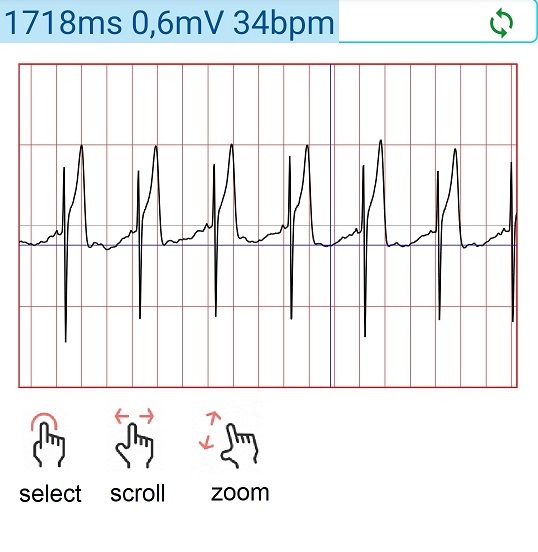
Explore graph data by tap, pitch and panning gestures
- If you want clicking SHARE you can share the results and the signal file with your favourite app
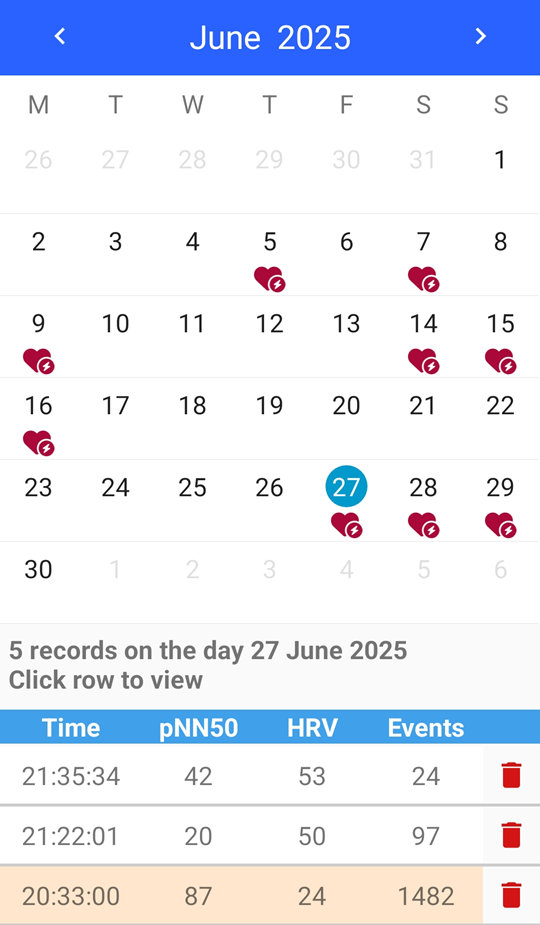
- At historic menu item, you can access to historic recordings
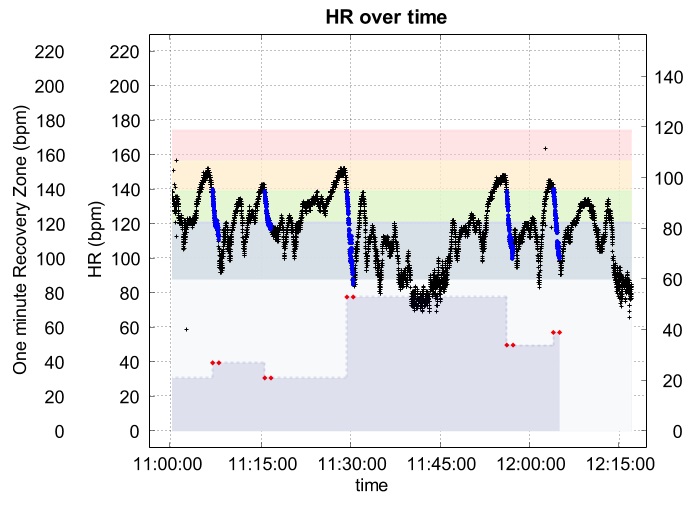
- If in your training you reach the zone of 90% of your maximum heart rate for one minute, when you go down from the zone, the graph of the recovery and the Heart Rate Recovery Index (HRR) will be displayed
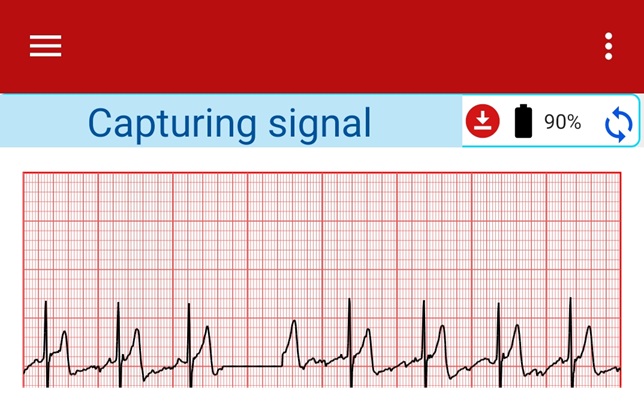
- Notice about quality of signal
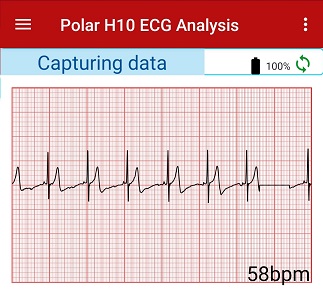
When the battery is at 100% the quality of the ECG signal is good. But when the battery level drops below 50%, the signal starts to degrade.
The sensor should not operate with a battery level below 40%.Example of good quality of ECG signal:
Example of poor quality of ECG signal:
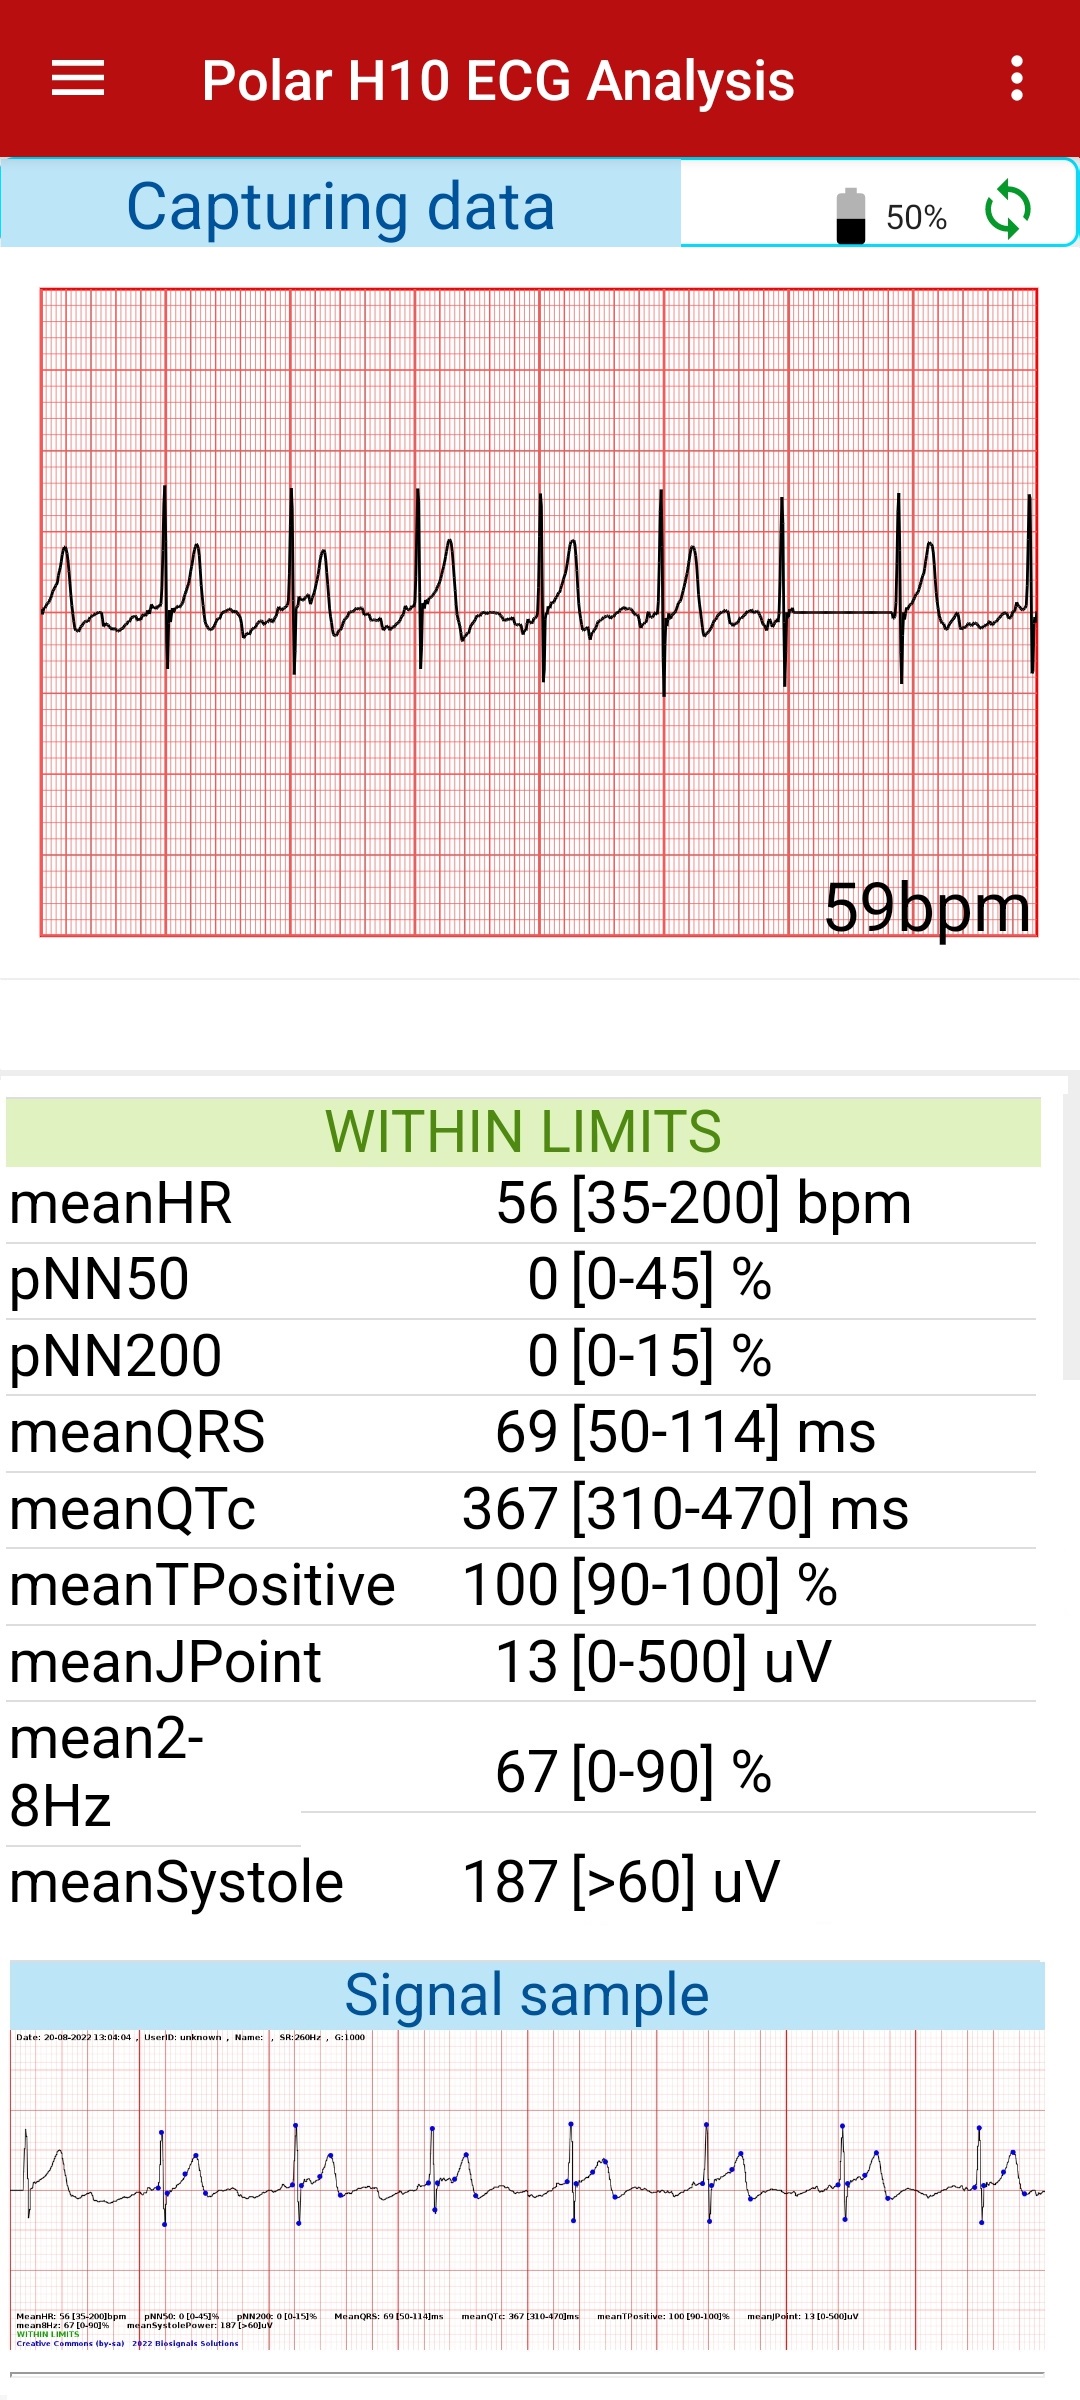
Observe blue dots position on the signal intervals.
- Sensor Firmware Update Notice
If the following icon appears next to the battery level, it indicates that a new version of the sensor firmware is available and needs to be updated. To update the firmware, use the Polar Flow app. For more information, visit https://support.polar.com/en/support/how_can_i_update_polar_h10.
ECG Viewer for .EDF files
The App opens doors to specialists and researchers by saving the files in .EDF (European Data Format).
The .EDF files follow a standard format, which can be opened with several outside applications or scripts, such as MATLAB or EDFBrowser.
With the EDF Browser program you can load .EDF, plot signal, and convert to CSV and so on. https://www.teuniz.net/edfbrowser/
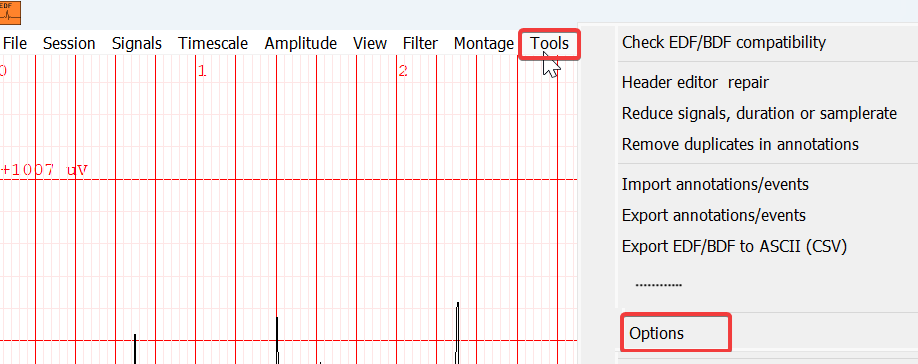
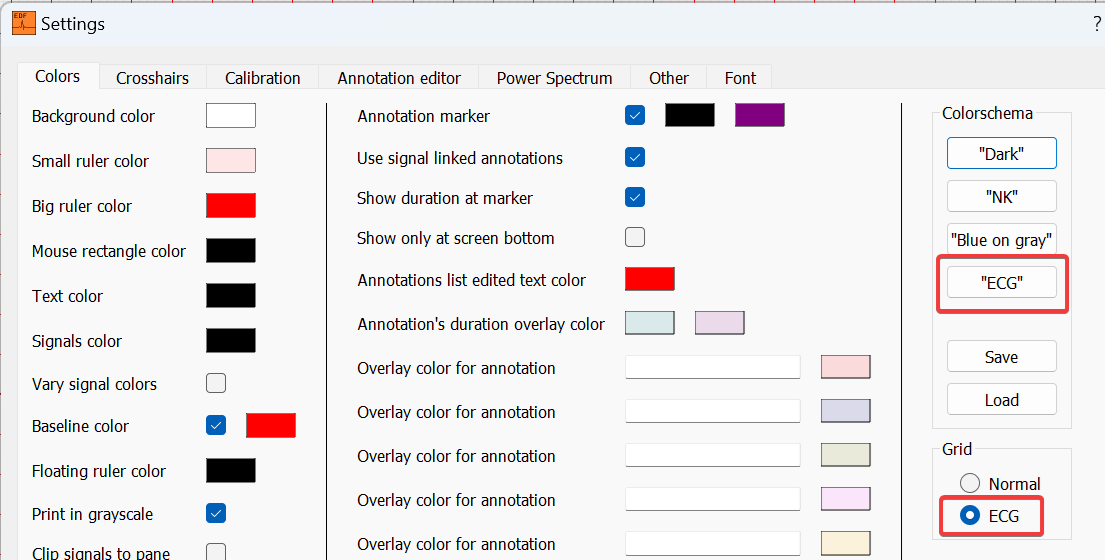
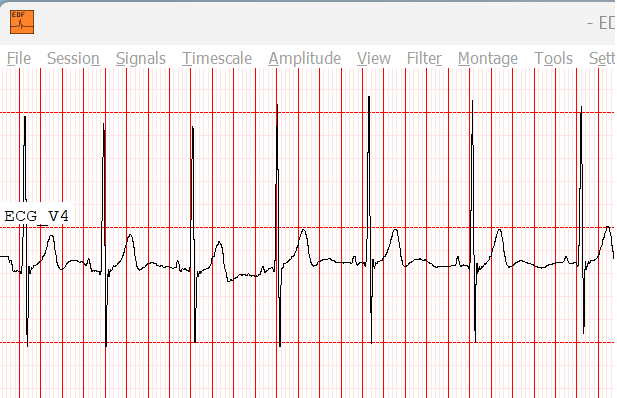
- Setup paper grid, go to Tools | Options then go to Colors Tab, and click ECG color schema and ECG grid.
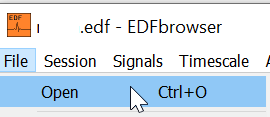
- From menu File | Open .EDF:
- Then select signal:
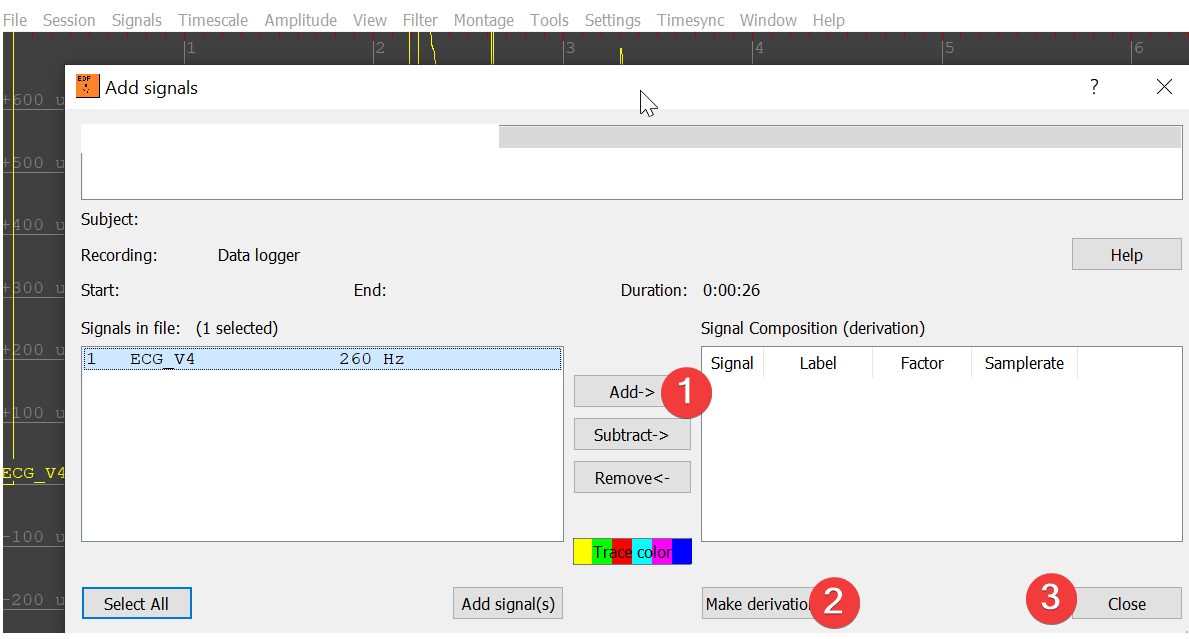
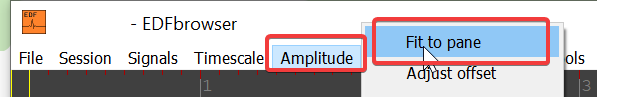
- Fit signal on screen:
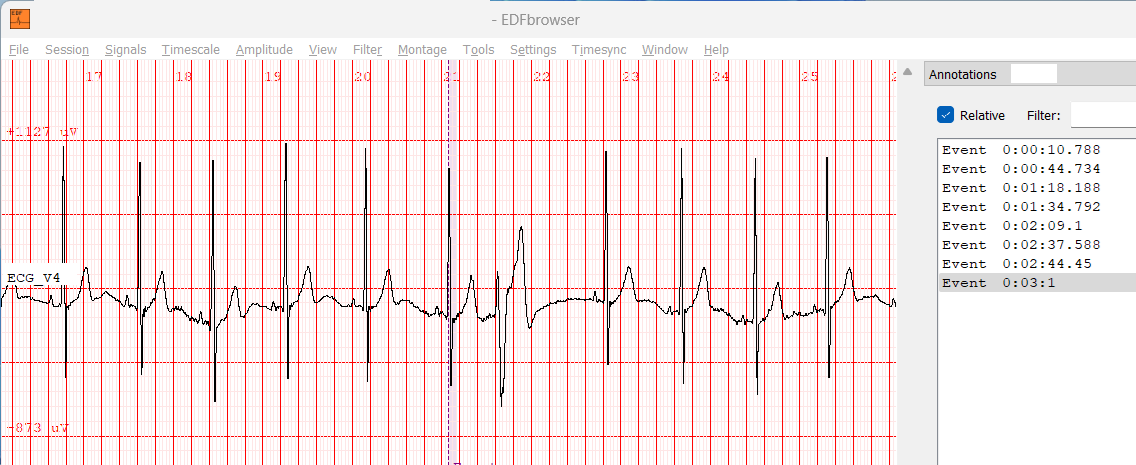
- Furthermore EDFBrowser can load events generated by App. The .XML file contains the events marked by the app in a format readable from EDFBrowser program. To import events:
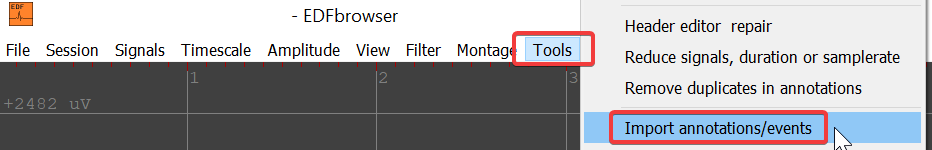
- Select XML format:
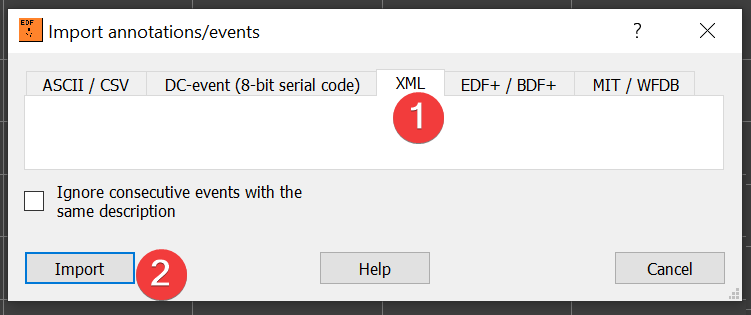
- Click “Import” button to load .XML file. On the right side, you can browse over events:
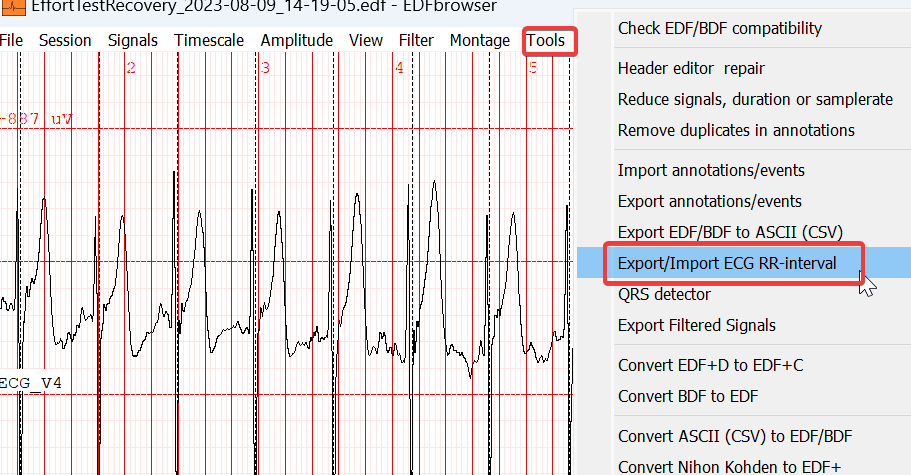
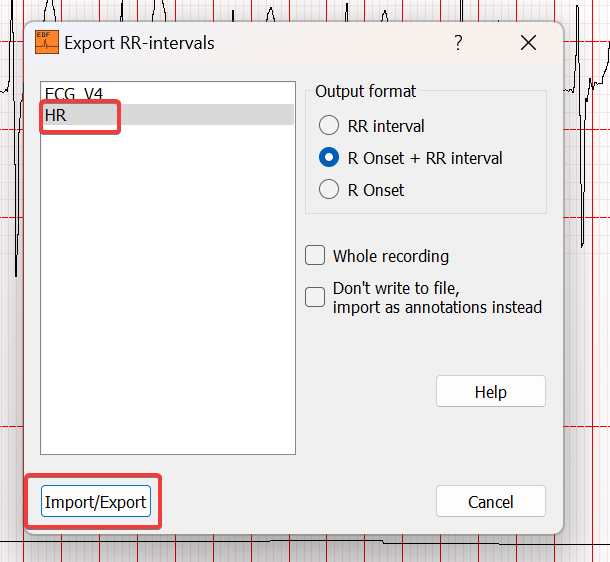
Exporting RR intervals to CSV file
To export Heart Rate to CSV as the RR-interval (ms), open the .EDF file using the EDFBrowser and use the export option. Note that the RR interval is similar to the HeartRate measurement, but instead of being in bpm it is in milliseconds (ms).
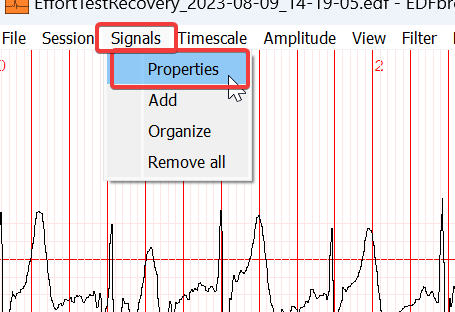
- Configure Heart Rate properties to ceate HR values
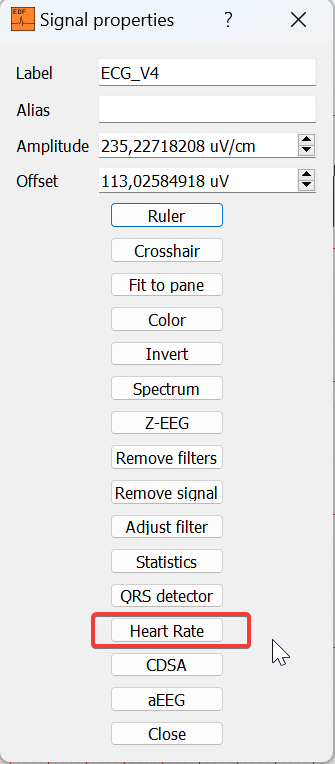
- Export RR-interval
Troubleshooting
-
Issue: Sometimes the App terminates unexpectedly.
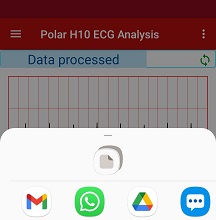
When there are many applications opened, consuming a lot of RAM, Android devices tend to close applications indiscriminately. To avoid this situation, we strongly recommend close unnecessary applications frequently., or press the “Close all” button in Android device.

Most Android devices have a built-in battery optimizer, which manages the device’s apps in order to conserve battery. Unfortunately, these Battery Optimizations sometimes terminate the app unexpectedly. To mitigate this problem, you will ask Allow to stop battery optimising while the App is running.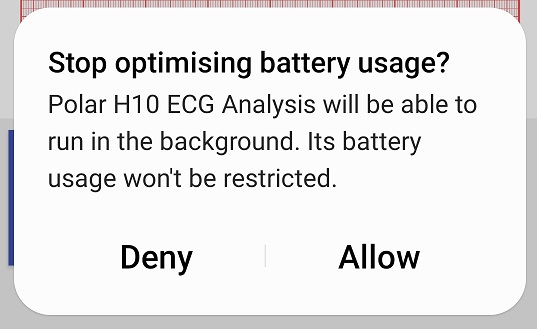
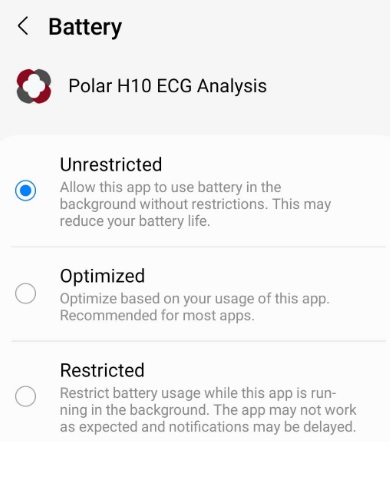
Furthermore, there are other settings that can be configured to make it work properly. Below is an example of how it should be configured for Samsung devices.- Go to your phone Settings > Apps > Polar H10 ECG analysis > Battery
Select: Unrestricted
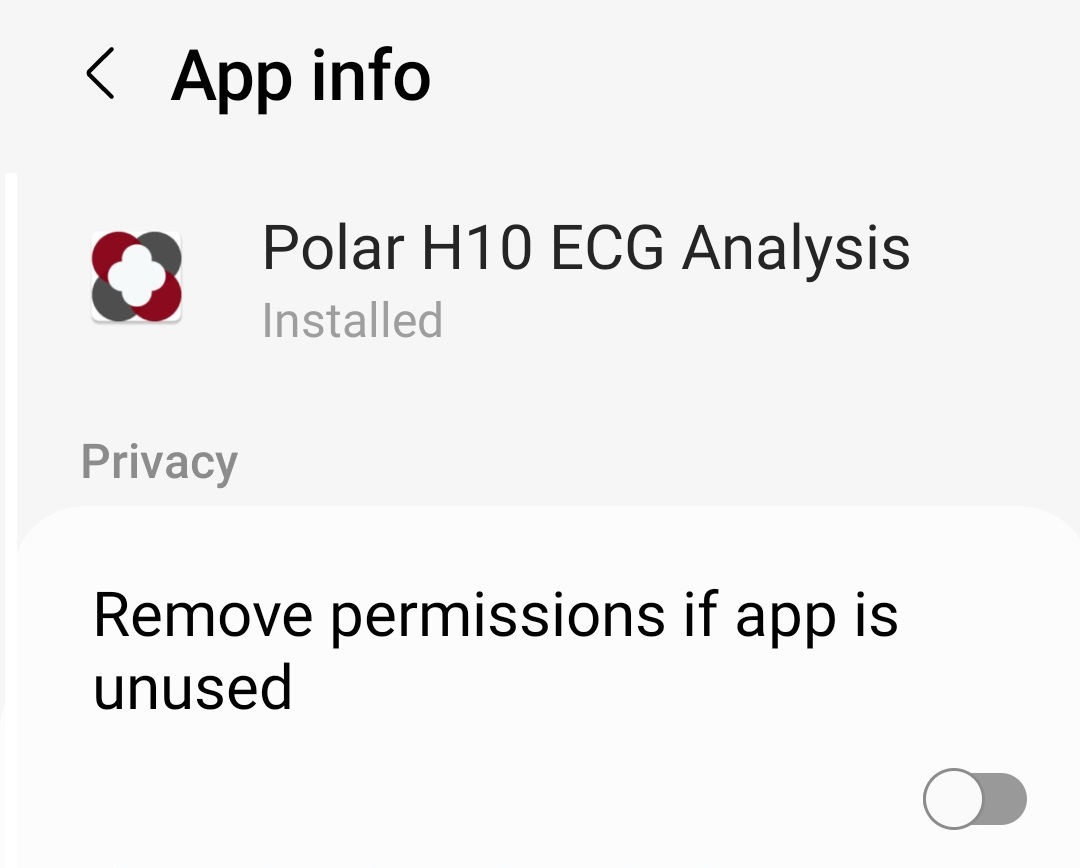
- Go to your phone Settings > Apps > Polar H10 ECG analysis
Make sure that Remove permissions if app is unused is disabled
If the previous settings did not solve the problem, you can choose to change the general device behaviour for all applications. The following options may affect battery performance.
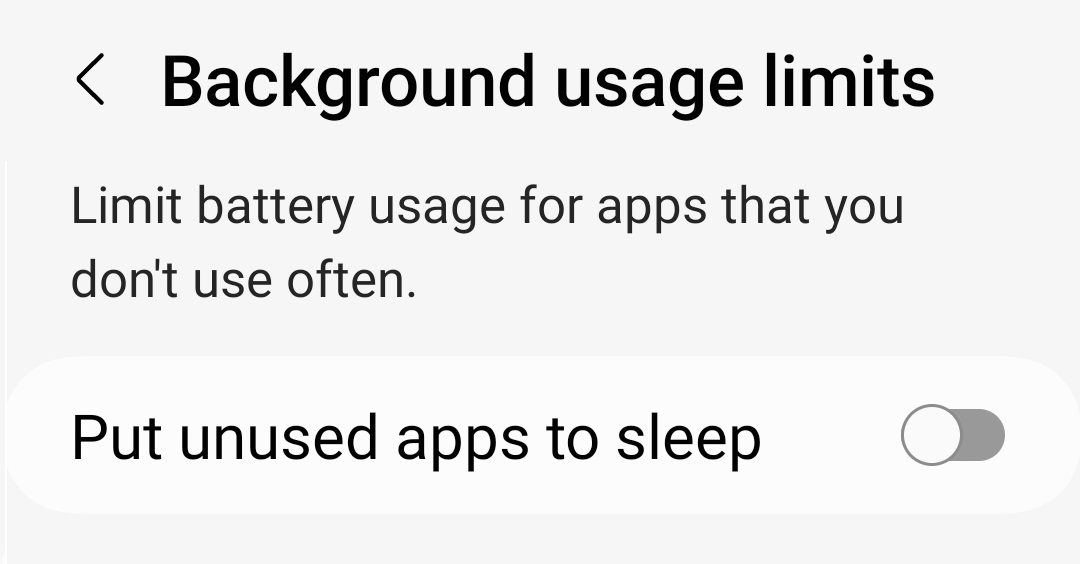
- Go to your phone Settings > Battery and device care > Battery > Background usage limits
Make sure that disable: Put unused apps to sleep
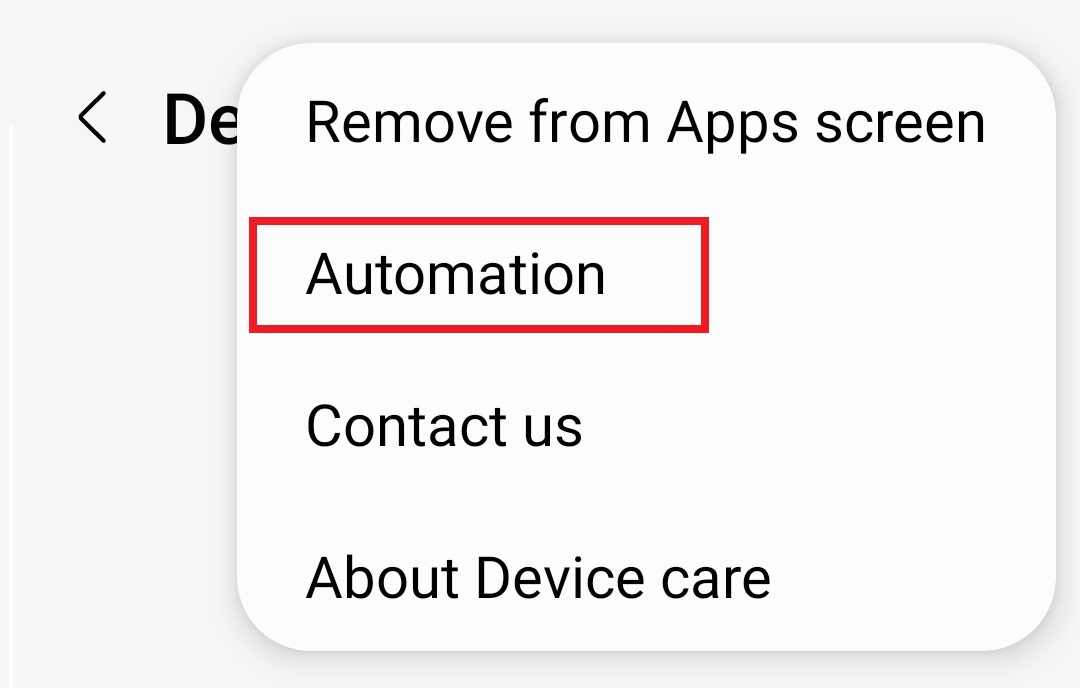
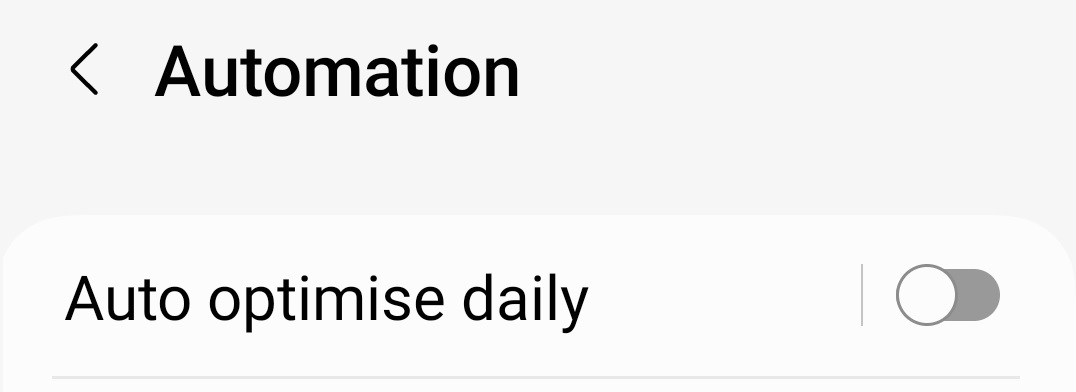
- Go to your phone Settings > Battery and device care > Three dots (top right corner) > Automation Make sure that disable: Auto-optimize daily and Adaptive power saving
You can find more information on the page https://dontkillmyapp.com which describes how to minimize app restart problems, depending on the mobile manufacturer and Android version. - Go to your phone Settings > Apps > Polar H10 ECG analysis > Battery
-
Issue: The quality of signals is low
It is recommended to work with a battery level higher than 40%. On the other hand, when the battery level is less than 15% you could have Bluetooth connection problems.
-
Issue: You cannot connect to your sensor at all if you are a new user with Android 13
Please update firmware sensor. More info at https://support.polar.com/en/support/how_can_i_update_polar_h10
Several App connected to sensor
If you want to enable the sensor to communicate with more than one application, it must be configured from the Polar Beat application.
Important: There is a startup order if you want multiple apps to connect to the sensor at the same time. First, you must start the ECG Analysis for Polar H10 application, and then the other apps, such as Polar Beat. Although this communication is possible, it is recommended that only one application access the sensor.
To enable HR reception on two BLE devices:
-
- Wear the sensor to wake it up.
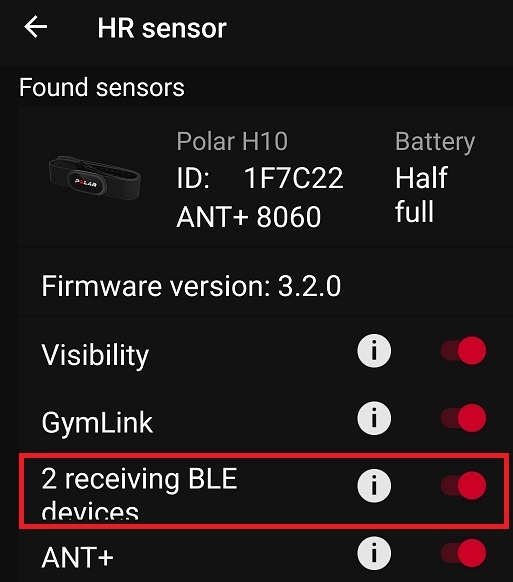
- Open Polar Beat App (no Polar Flow App), and enter to the settings item menu.
- Click over the text “Polar H10”.
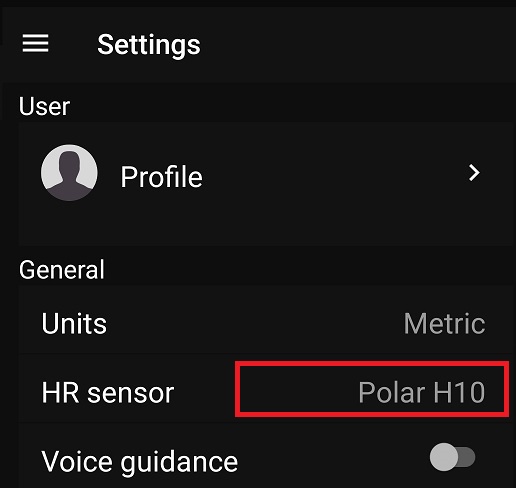
- Turn on “2 receiving BLE devices” option.
![]()
About Electrocardiogram
The following figure shows an example of the intervals in a typical ECG signal. Note that there may be other forms of signals that are also typical or within range. An ECG contains waves, intervals, segments and complex as showed below.
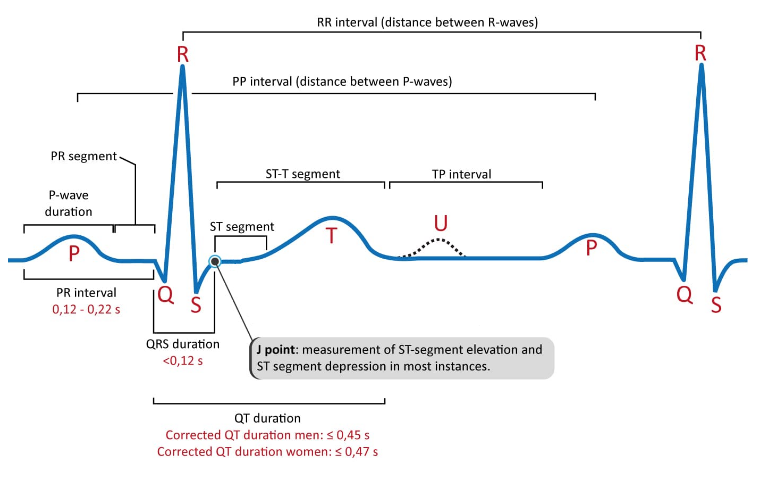
- Wave: A positive or negative deflection from baseline that indicates a specific electrical change. The waves on an ECG include the P wave, Q wave, R wave, S wave, T wave and U wave.
- Interval: The time between two specific ECG events. The intervals commonly measured on an ECG include the PR interval, QRS interval (also called QRS duration), QT interval and RR interval.
- Segment: The length between two specific points on an ECG that are supposed to be at the baseline amplitude (not negative or positive). The segments on an ECG include the PR segment, ST segment and TP segment.
- Complex: The combination of multiple waves grouped together. The only main complex on an ECG is the QRS complex.
- Point: There is only one point on an ECG termed the J point, which is where the QRS complex ends and the ST segment begins.
Measures and stats
A detail information about measures can be found at https://biosignalssolutions.ydns.eu/measures-stats-polarecganalysis/
- meanHR
Units in beats per minute (bpm)
The heart rate (HR) is the number of times the heart beats in the space of a minute. The meanHR sum of the HR values divided by the number of values in the recorded session. - HRV
Heart Rate Variability (HRV) is a simple measure related to the activity of the parasympathetic branch of the Autonomic (unconscious) Nervous System (ANS). For example, this measure could provide you what is your stress level.
Observing HRV is a valuable tool for assessing cardiovascular health, optimizing sport performance, managing stress, sleep disorders, evaluating the autonomic nervous system, and optimizing performance in various fields, from biofeedback to therapy. HRV provides valuable information that can be used to make informed decisions about health and well-being.
HRV is a measurement that is best interpreted in the context of the individual and their specific characteristics. Mainly comparing the evolution of values with respect to oneself, you need to establish a baseline of a few days to compare to before you can start comparing your recent past and telling you whether your Autonomic Nervous System. - pNN50
Units in percentile (%)
Is the percentage of beats, when between one beat and the next one, there is a difference of more than 50 milliseconds. This measurement is used to see the heart rate variability. - pNN200
Units in percentile (%)
Is the percentage of beats, when between one beat and the next one, there is a difference of more than 200 milliseconds. This measurement is used to see the heart rate variability. - meanQRS
Units in milliseconds (ms)
Mean value of all QRS intervals - meanQTc
Units in milliseconds (ms)
Mean value of all QTc interval. Represents the total time from ventricular depolarization to complete repolarization. This process begins at the start of the q wave and extends to the end of the T wave. - meanTPositive
Units in percentile (%) Is the percentage of positive T waves T waves can be positive or negative, depending on the shape of the wave. Is a statistical percentage that indicates the number of waves that are positive (upright). - meanJpoint
Units in microvolts (uV) Mean value on Jpoint - meanHF
Units in percentile (%)
Is the percentage of waves with high frequency oscillation - meanSystole
Units in microvolts (uV)
It is the level of electrical potential of the signal. - Heart Rate Effort Index
Is an intensity level measure of exercise (together with duration and frequency).
Measure of how straining a physical activity is for you – it’s always personal. This means the exertion from the same exercise may be completely different depending on the individual. It can take values from 1. - Best Heart Rate Recovery Index
If in your training you reach the zone of 90% of your maximum heartrate for one minute, when you go down from the zone, the graph of the recovery and the Heart Rate Recovery Index (HRR) will be displayed.
Heart Rate Recovery index is an estimate of maximal aerobic performance, which is influenced by aerobic fitness and running economy. It compares the highest number of heartbeats per minute (bpm) you can achieve in all-out effort and the lowest number of heartbeats per minute (bpm) at rest. By observing this value over time, you can monitor progress. Higher values mean that at a given pace it requires less effort, or that your pace is faster at a given level of effort.
Both measures allow you to learn how much exercise and strain your body can take and how much rest is optimal for you. - RR-QTc Poincare plot
Poincare plot
Very useful to heart rate variability and dispersion analysis vs QTc variation - Events
The application sometimes can detect some events where there is an etopic beats. No all irregular beats can be detected, and the number of beats detected are limited by memory device requeriments and user subscription plans.
Subscriptions
We need financial support. We release the app free for 17 months and to maintain the project and improve the features we must have income to pay the servers, developers and specialists.
You can use the application for free, with a usage limit in periods of the last 30 days. If more uses are needed, you must subscribe.
More information at https://biosignalssolutions.ydns.eu/pricing/
IMPORTANT NOTICE
The use of the app and site is not intended to be a substitute for professional medical advice, diagnose, treat, or prevent any disease or health condition. If you are concerned about your health, consult a medical specialist immediately. THE APP AND WEB SITE DO NOT OFFER MEDICAL ADVICE. The results are statistical and could be wrong.
More help at:
Polar H10® firmware requirements 3.2. To update firmware, use Polar Flow® App.
![]()